Display Sourcing and Procurement Report by Top Spending Regions and Market Price Trends - Forecast and Analysis 2023-2027
| Published: Sep 2023 | Pages: 122 | SKU: IRCMSTR22401 |
Display Procurement - Sourcing and Intelligence Report on Price Trends and Spend & Growth Analysis
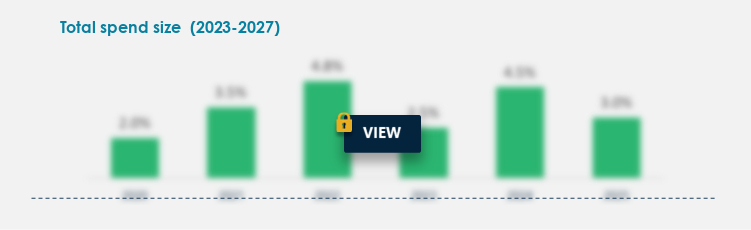
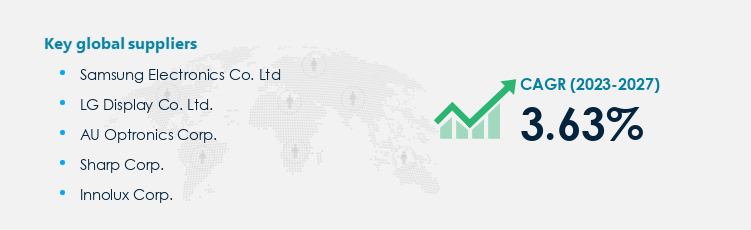
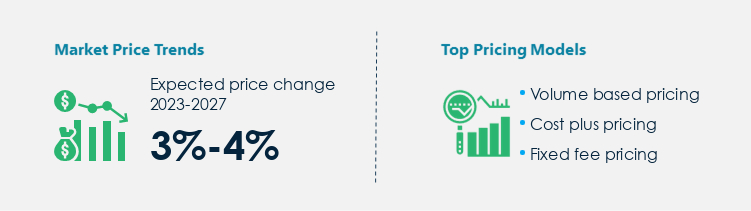
The display procurement category is projected to grow at a CAGR of 3.63% during 2023-2027. The prices are outlined to rise by 3%-4% during the forecast period and suppliers will have a High bargaining power in this market. Samsung Electronics Co. Ltd., LG Display Co. Ltd., and AU Optronics Corp. are a few of the key suppliers in the display market.
To unlock the YoY growth values for 2023-2027, Request a FREE Sample Report!
Who are the Top Suppliers in the Display Market?
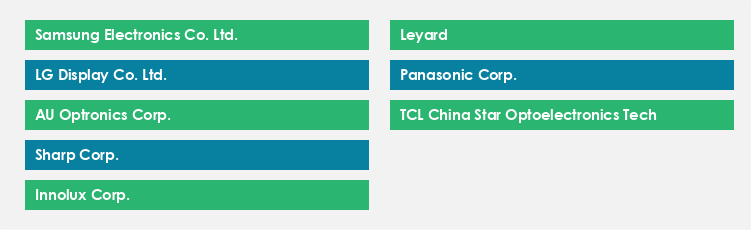
This report offers detailed insights and analysis of the major cost drivers, volume drivers, and innovations of the display procurement and sourcing market, which the global suppliers have been leveraging to gain a competitive edge across regions. Some of the leading display suppliers profiled extensively in this report include:
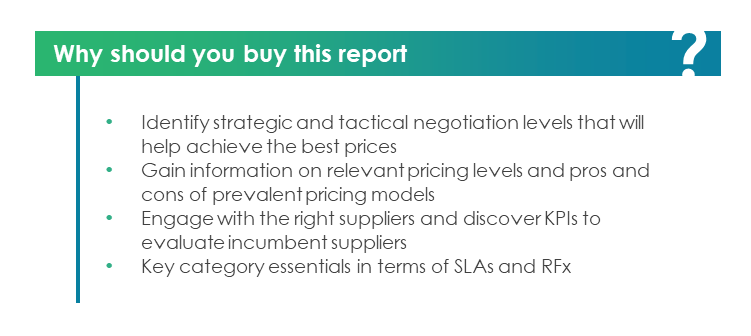
Furthermore, this display procurement market report provides a detailed analysis of procurement strategies deployed by major category end-users across several industries while sourcing for display requirements. In addition, most adopted and high-potential pricing models considered by buyers have been analyzed in this report, which will help understand business scopes for revenue expansion. These data will assist buyers in realizing cost savings and identifying business strategies to improve sales.
What are the Most Suitable Supplier Selection Criteria, Supplier Evaluation Metrics, and SLA that Buyers Should Consider?
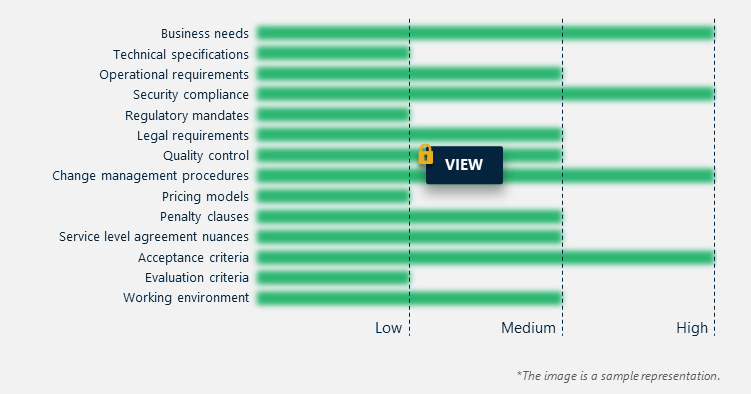
The display procurement market report provides a detailed analysis of various supplier selection criteria, RFX questions, supplier evaluation metrics, and the service level agreements that the buyers should consider adopting to achieve significant cost savings, streamline the procurement process, and reduce category TCO while sourcing for display requirements.
To get the exact category management parameters and unfold their degree of influence on this display procurement market in detail, Get the FREE Sample Report Now!
What are the Most Adopted Procurement Strategies by Buyers Across Industries?
The report provides a detailed insight into the most adopted procurement strategies by buyers across industries and an analysis of these strategies with respect to innovation, regulatory compliance, quality, supply, and cost. Adoption of these procurement strategies will enable the buyers to reduce category TCO and achieve cost savings while sourcing for display requirements.
What are the Major Pricing Models Adopted by Buyers in the Display Market?
The report discusses in detail each pricing model and the pros and cons attached to every pricing model prevalent in the market. Also, the report provides insights with respect to the category supply chain and the margins of various suppliers within the supply chain. These market analysis data will enable the buyers to make informed strategic sourcing decisions. Buy the full display procurement market report now to get comprehensive details on pricing models
Price Strategies and Benchmark
Request for a FREE sample to access the latest price forecasts, market drivers, and TCO reduction opportunities for the display market
To optimize the value of the purchase, it is crucial to keep track of current and future price trends. Price forecasts are beneficial in purchase planning, especially when supplemented by the constant monitoring of price-influencing factors. During the forecast period, the market expects an incremental spend of USD 30.52 billion due to various market drivers prevalent across multiple regions. Also, the report speaks about various cost-saving factors through analysis of the following factors:
- Identify favorable opportunities in display TCO (total cost of ownership)
- Expected changes in price forecast and factors driving the current and future price changes
- Identify pricing models that offer the most rewarding opportunities
What will the Spend Growth and Demand be by Region?
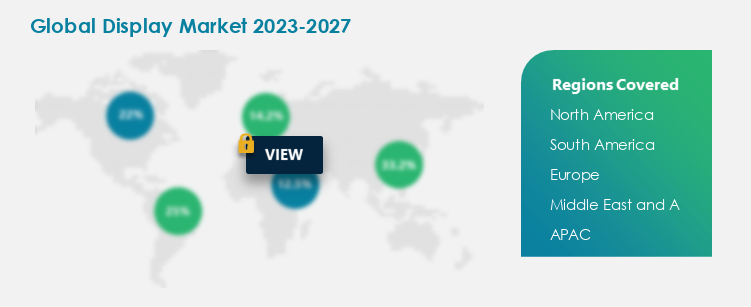
The display market will register an incremental spend of about USD 30.52 billion during the forecast period. However, only a few regions will drive the majority of this growth. Moreover, on the supply side, North America, Europe, and APAC will have the maximum influence owing to the supplier base. The growth is expected to be primarily driven by increasing demand and adoption of the category across those few regions. To get a detailed analysis of the volume drivers that are driving the adoption of the category across regions, buy the full report now!
The drivers and inhibitors that influence these global and regional outlooks are elaborated on in detail in this procurement report. Our in-depth growth decomposition analysis covers details on:
- Factors driving the growth (or lack of it) in individual geographies
- Regions that hold the most rewarding opportunities for buyers and suppliers
- Spend growth and regional spend segmentation over the coming years
Request a FREE sample for more information on the spending growth for the display procurement market
What are the Major Category Management Objectives for Display Sourcing?
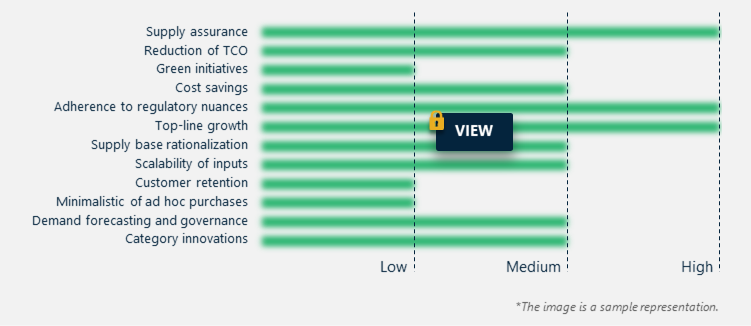
A targeted strategic approach to display sourcing will provide several opportunities. However, in the absence of actionable intelligence on display, buyers may end up focusing on a tactical sourcing strategy without any focus on cost-saving opportunities. Hence, this report focuses on category management initiatives such as scalability of inputs, category innovations, and minimalization of ad hoc purchases, which will assist buyers in formulating a strategic procurement strategy
The report explains the following key category management objectives that should form the base for sourcing strategy.
To explore the extent of influence of category management objectives that can improve the efficiencies of the retailers, Request a FREE Sample Report!
In addition to helping buyers identify the strategic goals and initiatives for category management, the report also has detailed insights into the most outsourced category management activities and category enablers which can simplify the procurement process for buyers.
|
Scope of Display |
|
|
Report Specs |
Details |
|
Page number |
122 |
|
Base year |
2022 |
|
Forecast period |
2023-2027 |
|
Spend growth (CAGR) |
3.63% |
|
Incremental spend |
USD 30.52 billion |
|
Pricing growth outlook |
3%-4% |
|
Pricing models |
Volume-based pricing, Cost-plus pricing, and Fixed fee pricing |
|
Supplier selection scope |
Wide geographic presence, Technological capabilities, Post-purchase services capability, and Portfolio range of suppliers |
|
Supplier opportunities |
Scalability of inputs, Category innovations, Minimalization of ad hoc purchases, Demand forecasting and governance, Supply base rationalization, Green initiatives, and Supply assurance |
|
Supplier selection criteria |
Business needs, Technical specifications, Operational requirements, Security compliance, Regulatory mandates, Legal requirements, Quality control, Change management procedures, Pricing models, Penalty clauses, SLA nuances, Acceptance criteria, and Evaluation criteria |
|
Category management scope |
Scalability of inputs, Category innovations, Minimalization of ad hoc purchases, Demand forecasting and governance, Supply base rationalization, Green initiatives, and Supply assurance |
|
Top suppliers |
Samsung Electronics Co. Ltd., LG Display Co. Ltd., AU Optronics Corp., Sharp Corp., Innolux Corp., Leyard, Panasonic Corp., and TCL China Star Optoelectronics Technology Co. Ltd. |
|
Market dynamics |
Regional category spending in terms of percentage with respect to North America, South America, Europe, Middle East Africa, and APAC and global category spending and CAGR in terms of percentage over a span of 5 years. |
|
Customization scope |
We can create customized sourcing/procurement reports with specific requirements for your business. |
Request for a FREE sample now!
Executive Summary
- Executive Summary
Market Insights
- Global category spend
- Spend segmentation by region
- Regional spend dynamics
- Regional influence on global spend
- Regional spend opportunity for suppliers
Category Pricing Insights
- Pricing
- Discounts on Prices
- Pricing outlook
- Supplier cost structure
- Overview of pricing models
- Comparison of pricing models
- Supply chain margins
- Cost and Volume drivers: Impact on pricing
Cost-saving Opportunities
- Cost-saving levers
- Quantifying cost-saving opportunities
- Quantifying cost savings by negotiation strategies
- Tactical cost saving levers
- Strategic cost saving levers
Best Practices
- Innovation and success stories
- Procurement excellence best practices
- Procurement best practices
- Sustainability practices
Category Ecosystem
- Market favorability index for suppliers
- Threat of rivalry
- Buyer power
- Supplier power
- Threat of new entrants
- Threat of substitutes
- Buyer ecosystem
- Supplier ecosystem
- Ecosystem disruption threats
Category Management Strategy
- Strategy objectives
- Supplier and buyer KPI's
- Outsourcing category management activities
- Outsourcing category management activities
- Risk management
- Risk management
Category Management Enablers
- Procurement organization
- Category enablers
Suppliers Selection
- RFx essentials
- Supplier selection criteria
- Service level agreement
- Incumbent supplier evaluation metrics
Suppliers under Coverage
- Suppliers covered
- Market positioning of suppliers
- Market positioning of suppliers
- Samsung Electronics Co. Ltd.
- LG Display Co. Ltd.
- AU Optronics Corp.
- Sharp Corp.
- Innolux Corp.
- Leyard
- Panasonic Corp.
- TCL China Star Optoelectronics Technology Co. Ltd.
US Market Insights
- Category spend in the US
- Pricing outlook in the US
- Category margins
- Category cost drivers
- Category volume drivers
- Overview of best practices in the US
- US supply market overview
- Market positioning of suppliers
- Market positioning of suppliers
- Regional category risks
- Regional category risks
Category Scope
- Category scope
Appendix
- List of abbreviations
- Key notes
Research Framework
SpendEdge presents a detailed picture of the market by way of study, synthesis, and summation of data from multiple sources. The analysts have presented the various facets of the market with a particular focus on identifying the key category influencers. The data thus presented is comprehensive, reliable, and the result of extensive research, both primary and secondary.
INFORMATION SOURCES
Primary sources
- Procurement heads
- Category managers
- Sourcing consortium professionals
- Procurement managers
- Category heads of suppliers
- Client account heads/managers
- Client and industry consultants
Secondary sources
- Industry journals and periodicals
- Periodicals and new articles
- Category webinars
- Industry and government websites on regulations and compliance
- Internal databases
- Industry blogs/thought leader briefings
DATA ANALYSIS

PURCHASE FULL REPORT OF
Display Sourcing and Procurement Report by Top Spending Regions and Market Price Trends - Forecast and Analysis 2023-2027